The Analytics Dashboard in DMLY provides a centralized view of your communication performance across all connected channels. It helps you track conversations, agent activity, contact growth, and engagement trends, all in one place.
The dashboard allows you to analyze:
Message activity across channels
Agent performance
Contact growth
Message trends over time
Peak communication hours
All reports can be filtered by date range and channel for deeper insights.
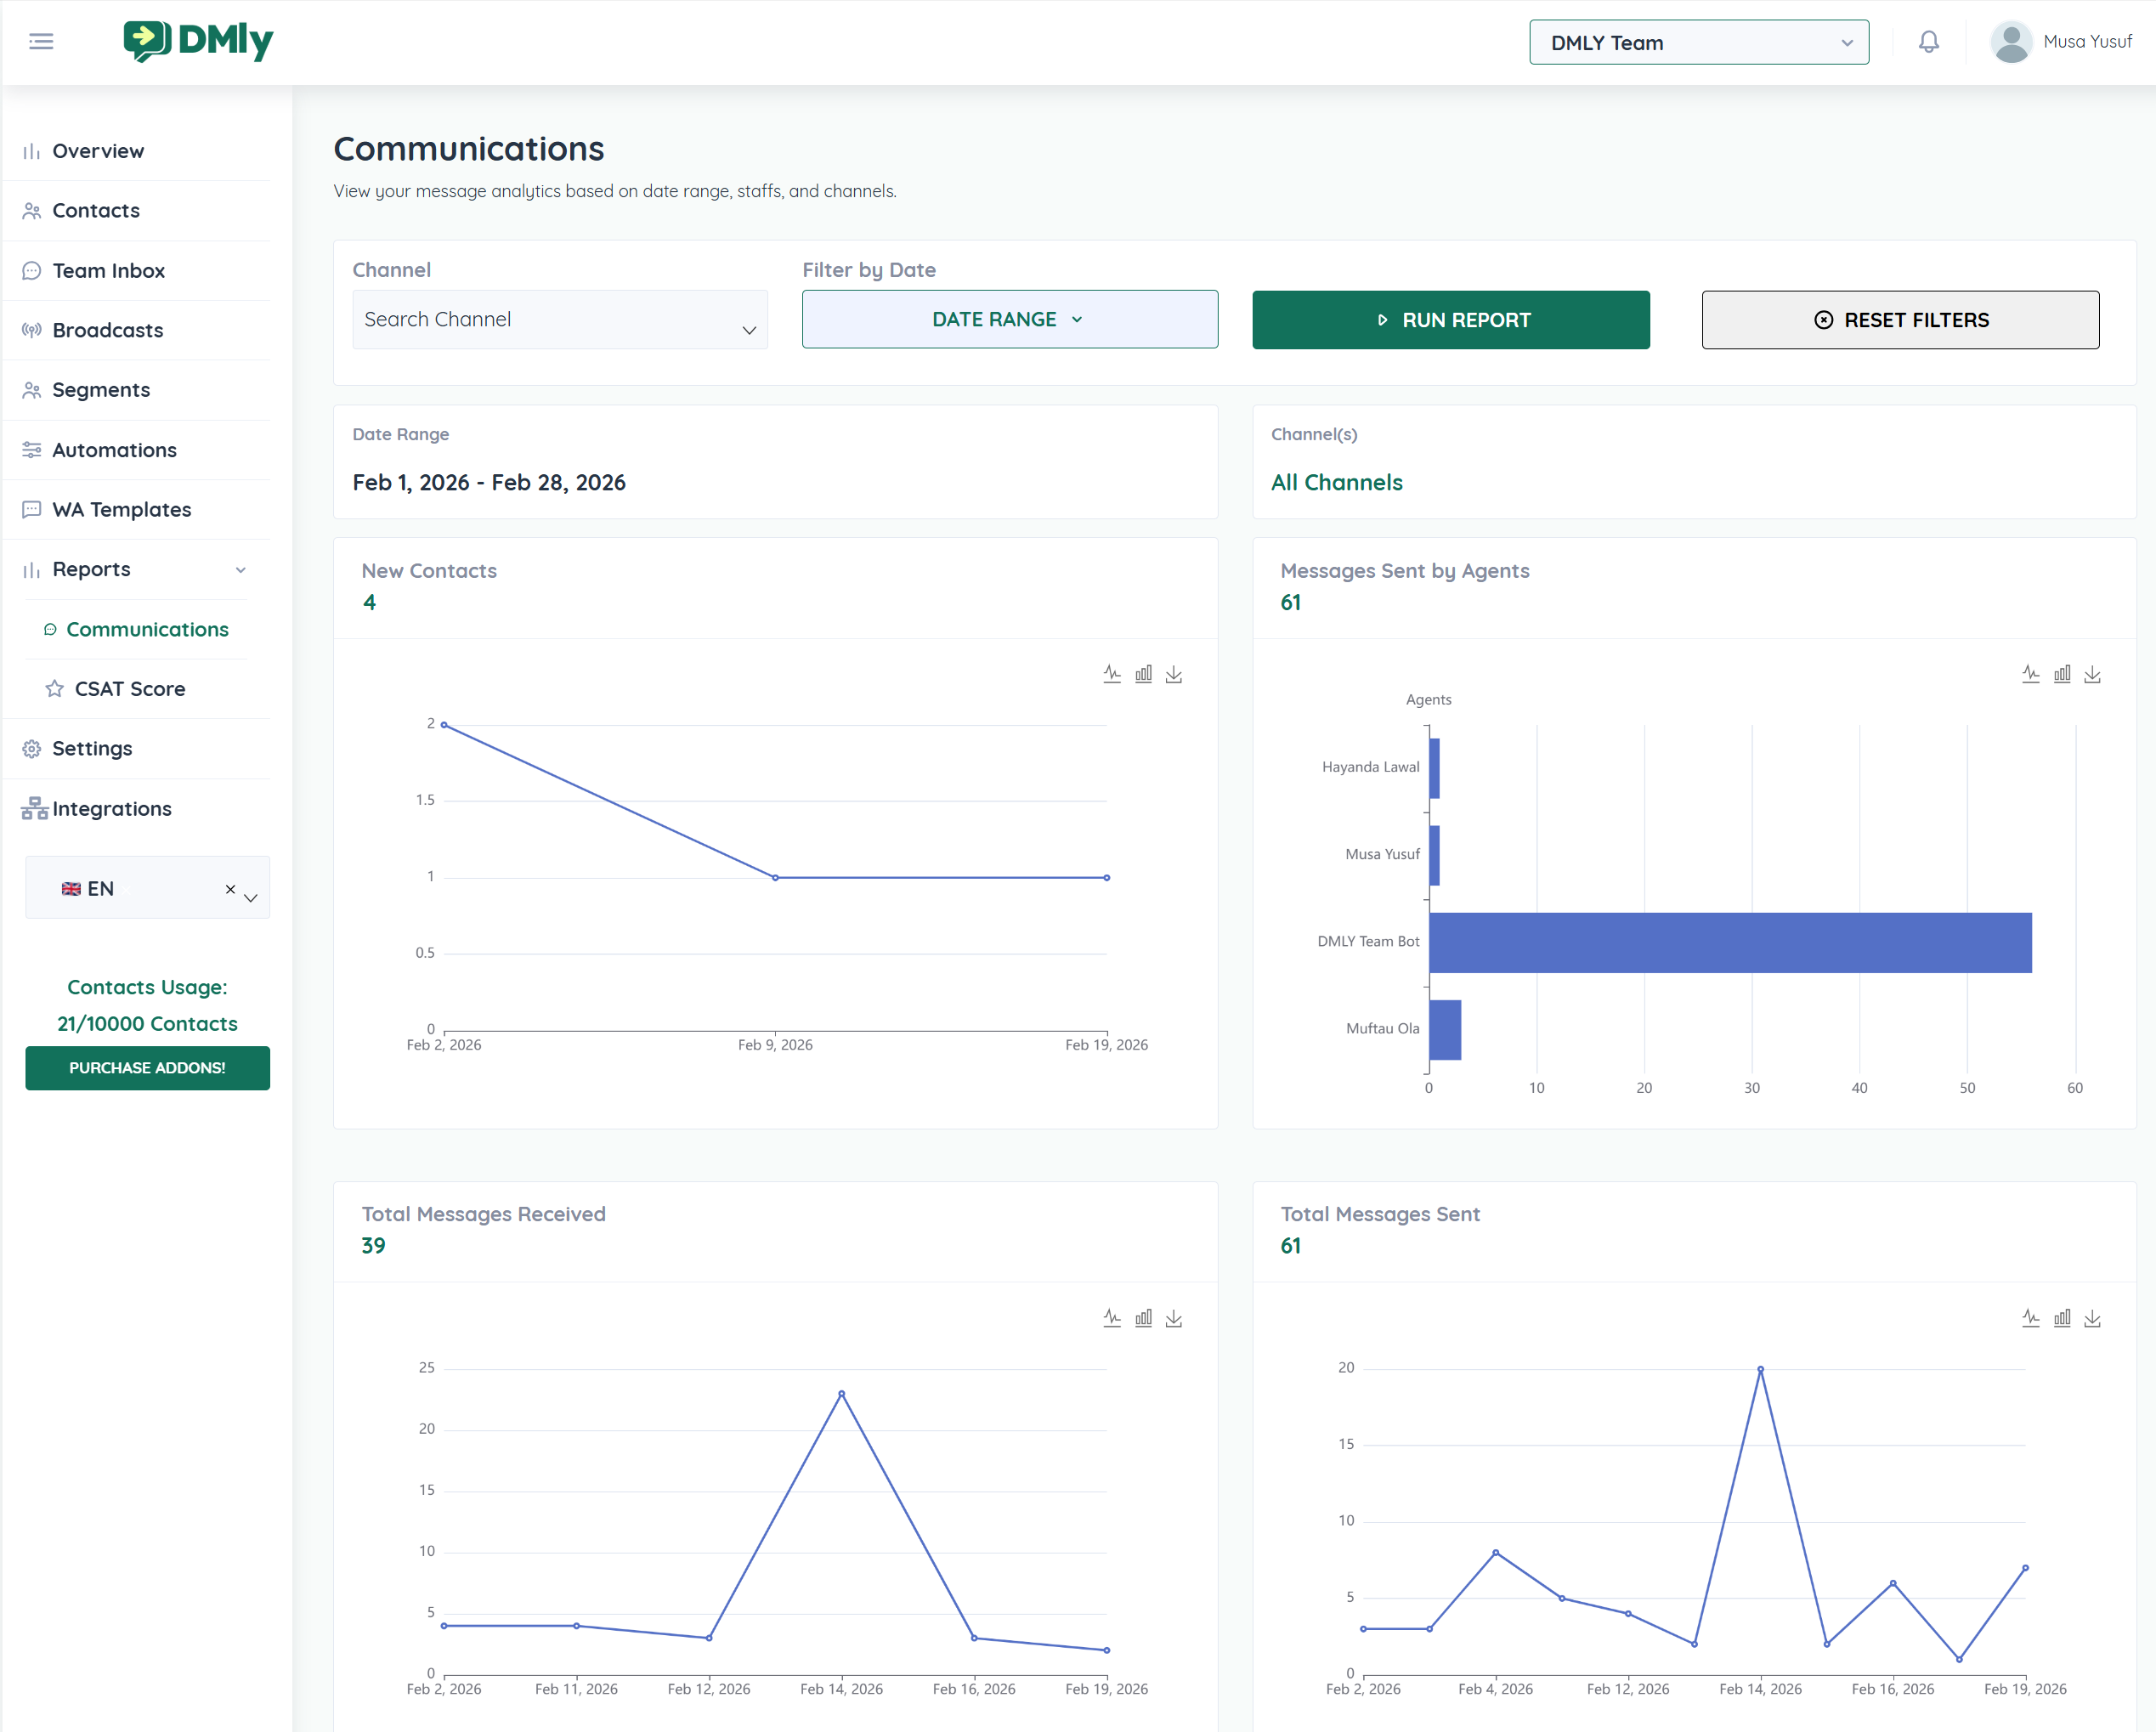
At the top of the dashboard, you can:
Select a specific Channel
Choose a Date Range
Click Run Report to refresh data
Use Reset Filters to clear selections
This ensures you can analyze performance for specific campaigns, weeks, months, or custom periods.
The dashboard displays the selected reporting period clearly so you always know which timeframe your analytics represent.
You can analyze:
Daily performance
Weekly activity
Monthly trends
Custom date ranges
Shows how many new contacts were added during the selected period.
This helps measure audience growth and lead acquisition.
Displays the total number of outgoing messages sent across channels.
This includes:
Agent replies
Bot responses
Broadcast messages
Shows incoming messages from customers.
This helps measure customer engagement and support demand.
Breakdown of message volume per team member.
This helps you:
Evaluate agent productivity
Identify workload distribution
Monitor bot vs human interaction levels
The dashboard includes interactive visual charts for better data interpretation:
Track trends over time for:
Messages sent
Messages received
New contacts
Helps identify spikes, campaign impact, and seasonal trends.
Compares message volume across agents and bots.
This highlights team contribution and automation performance.
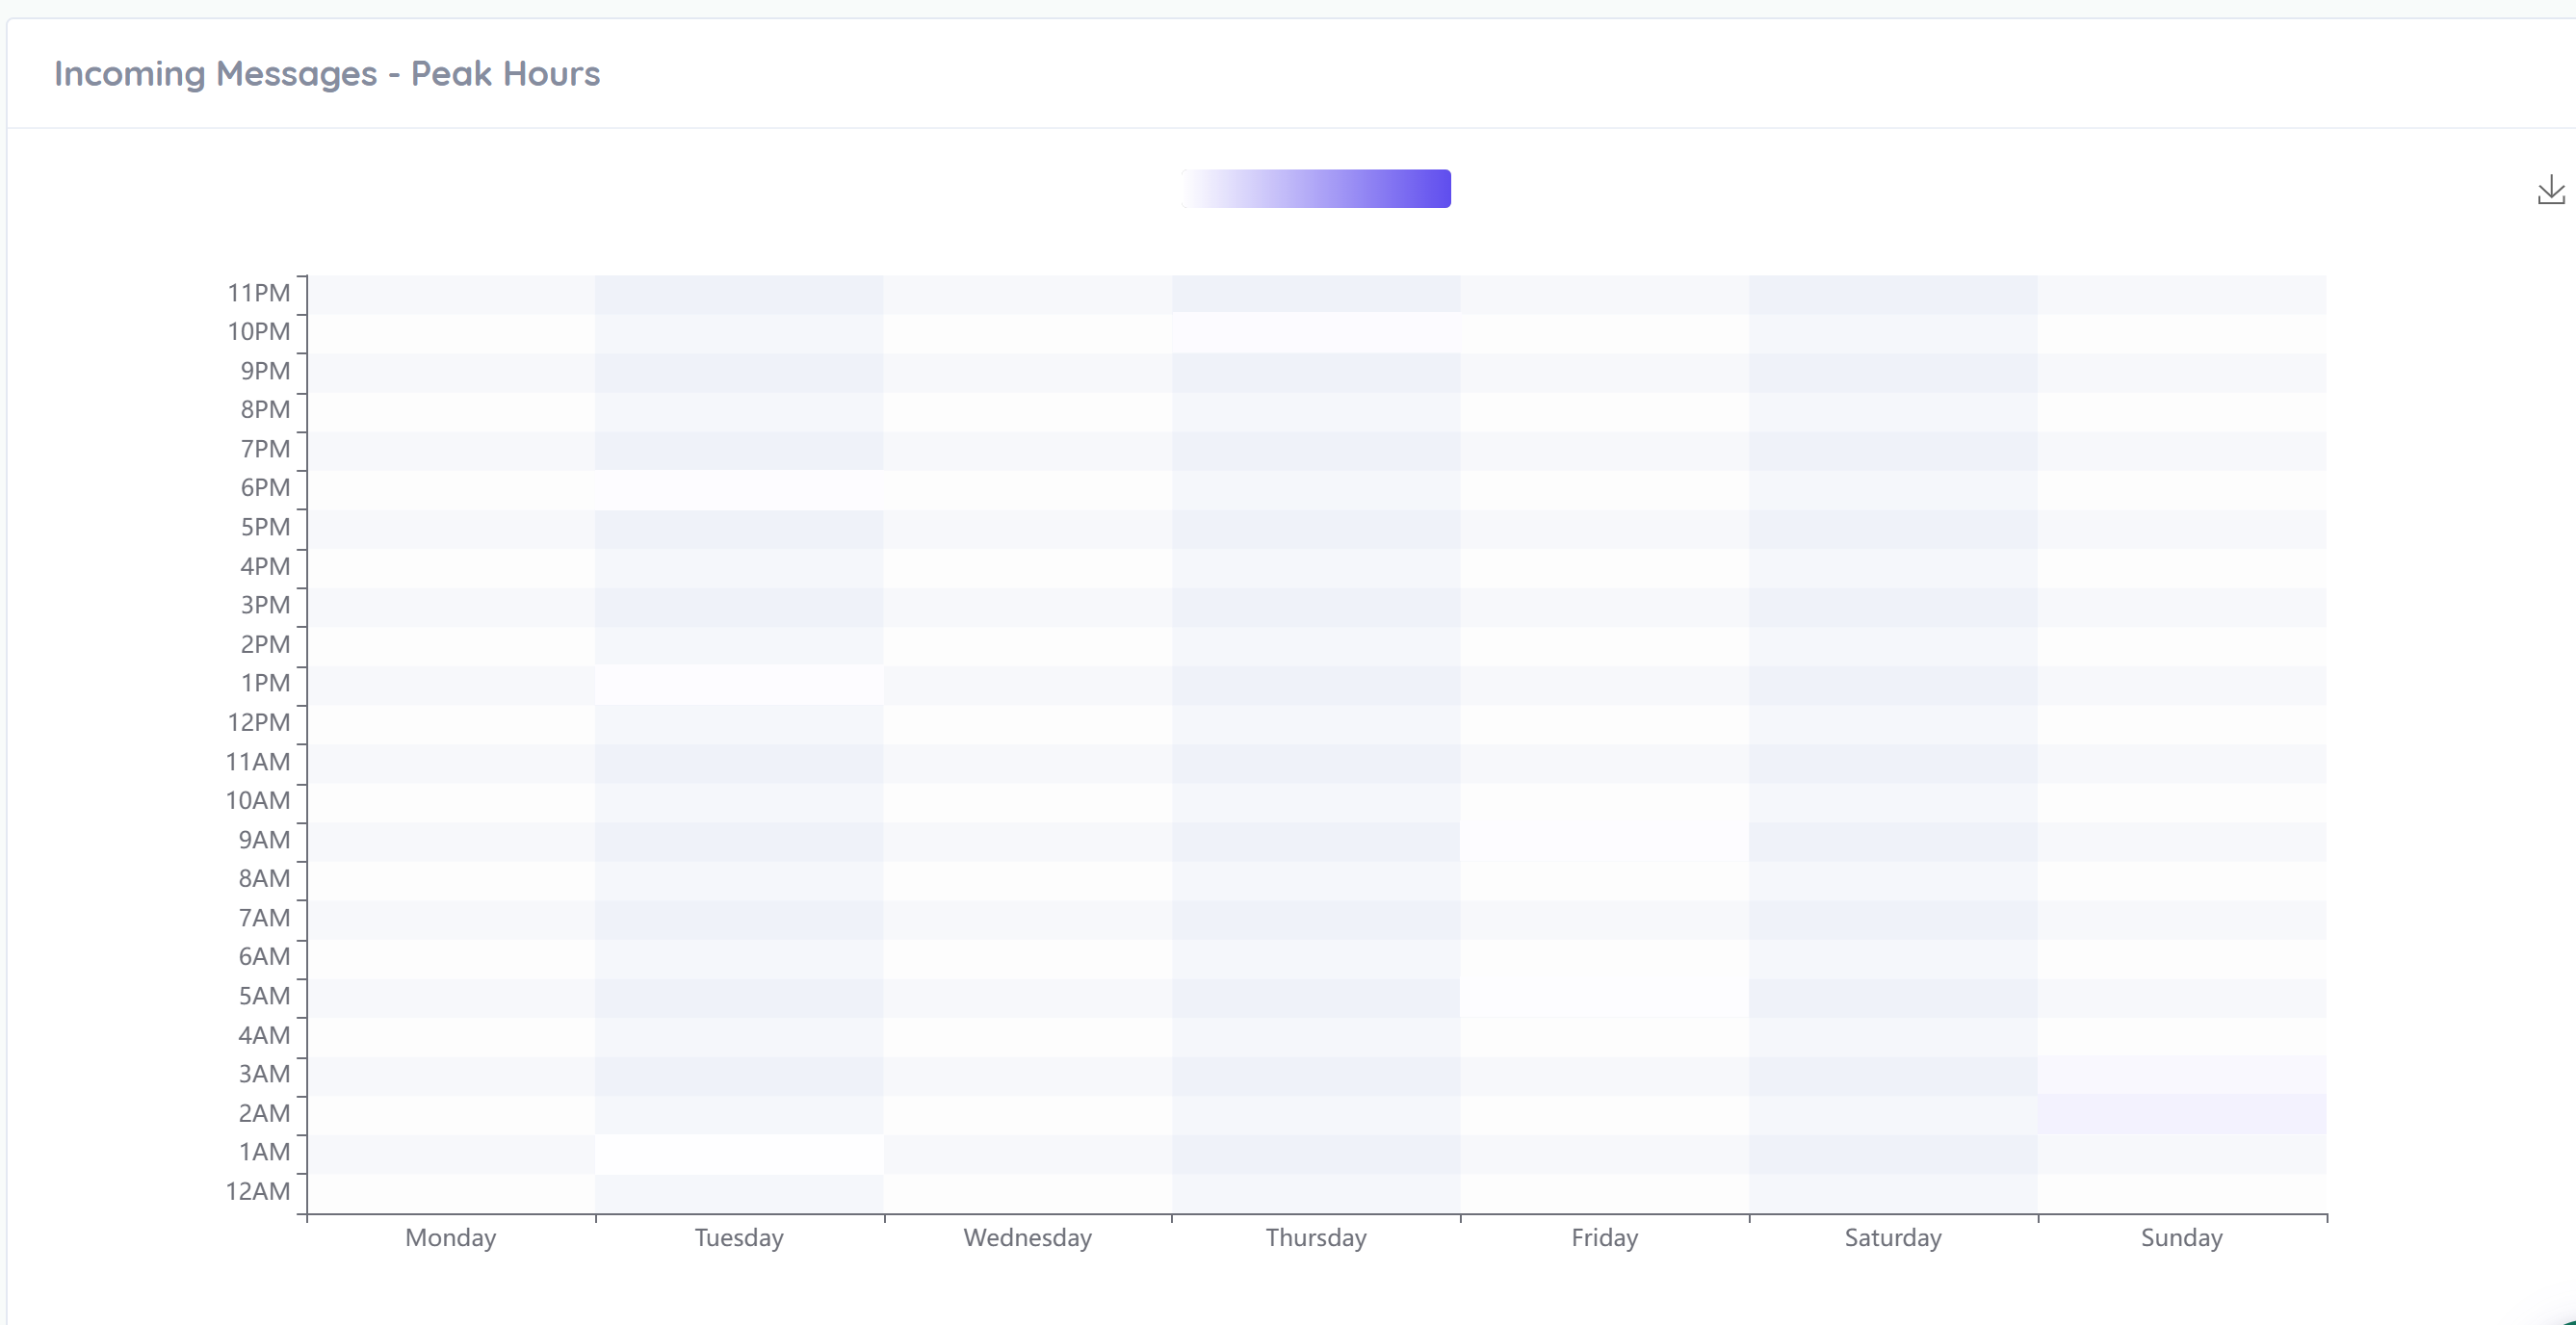
Displays busiest hours and days of the week.
This helps you:
Identify high-traffic periods
Schedule staff efficiently
Optimize response time
Plan broadcast timing
Darker areas indicate higher message volume.
Using analytics helps you:
Improve response times
Balance team workload
Measure campaign effectiveness
Identify engagement patterns
Optimize staffing during peak hours
Make data-driven decisions
To get the most out of the dashboard:
Review analytics weekly
Compare performance before and after campaigns
Monitor peak hours for staffing optimization
Track agent contribution regularly
Use data to refine messaging strategies
The DMLY Analytics Dashboard transforms raw message activity into actionable insights. By consistently reviewing your performance data, you can increase efficiency, improve customer satisfaction, and drive better results across all communication channels.