DMLY makes it easy to export your analytics data for presentations, performance reviews, and client reporting. Each analytics card on the dashboard includes an export option, allowing you to download visual reports instantly.
On every analytics card (such as:
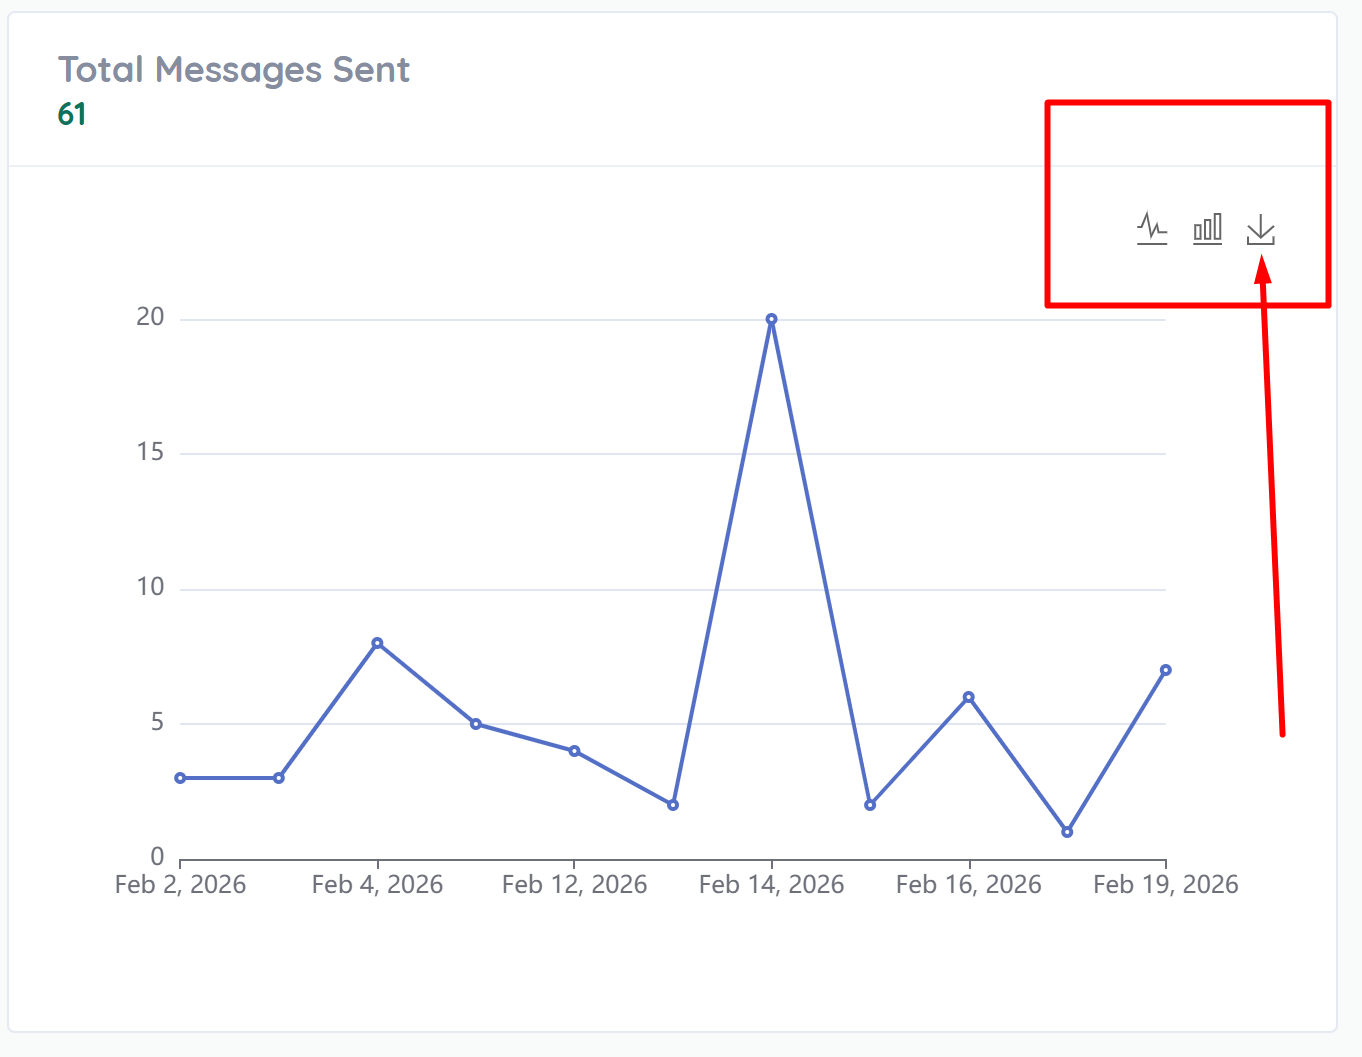
Total Messages Sent
Total Messages Received
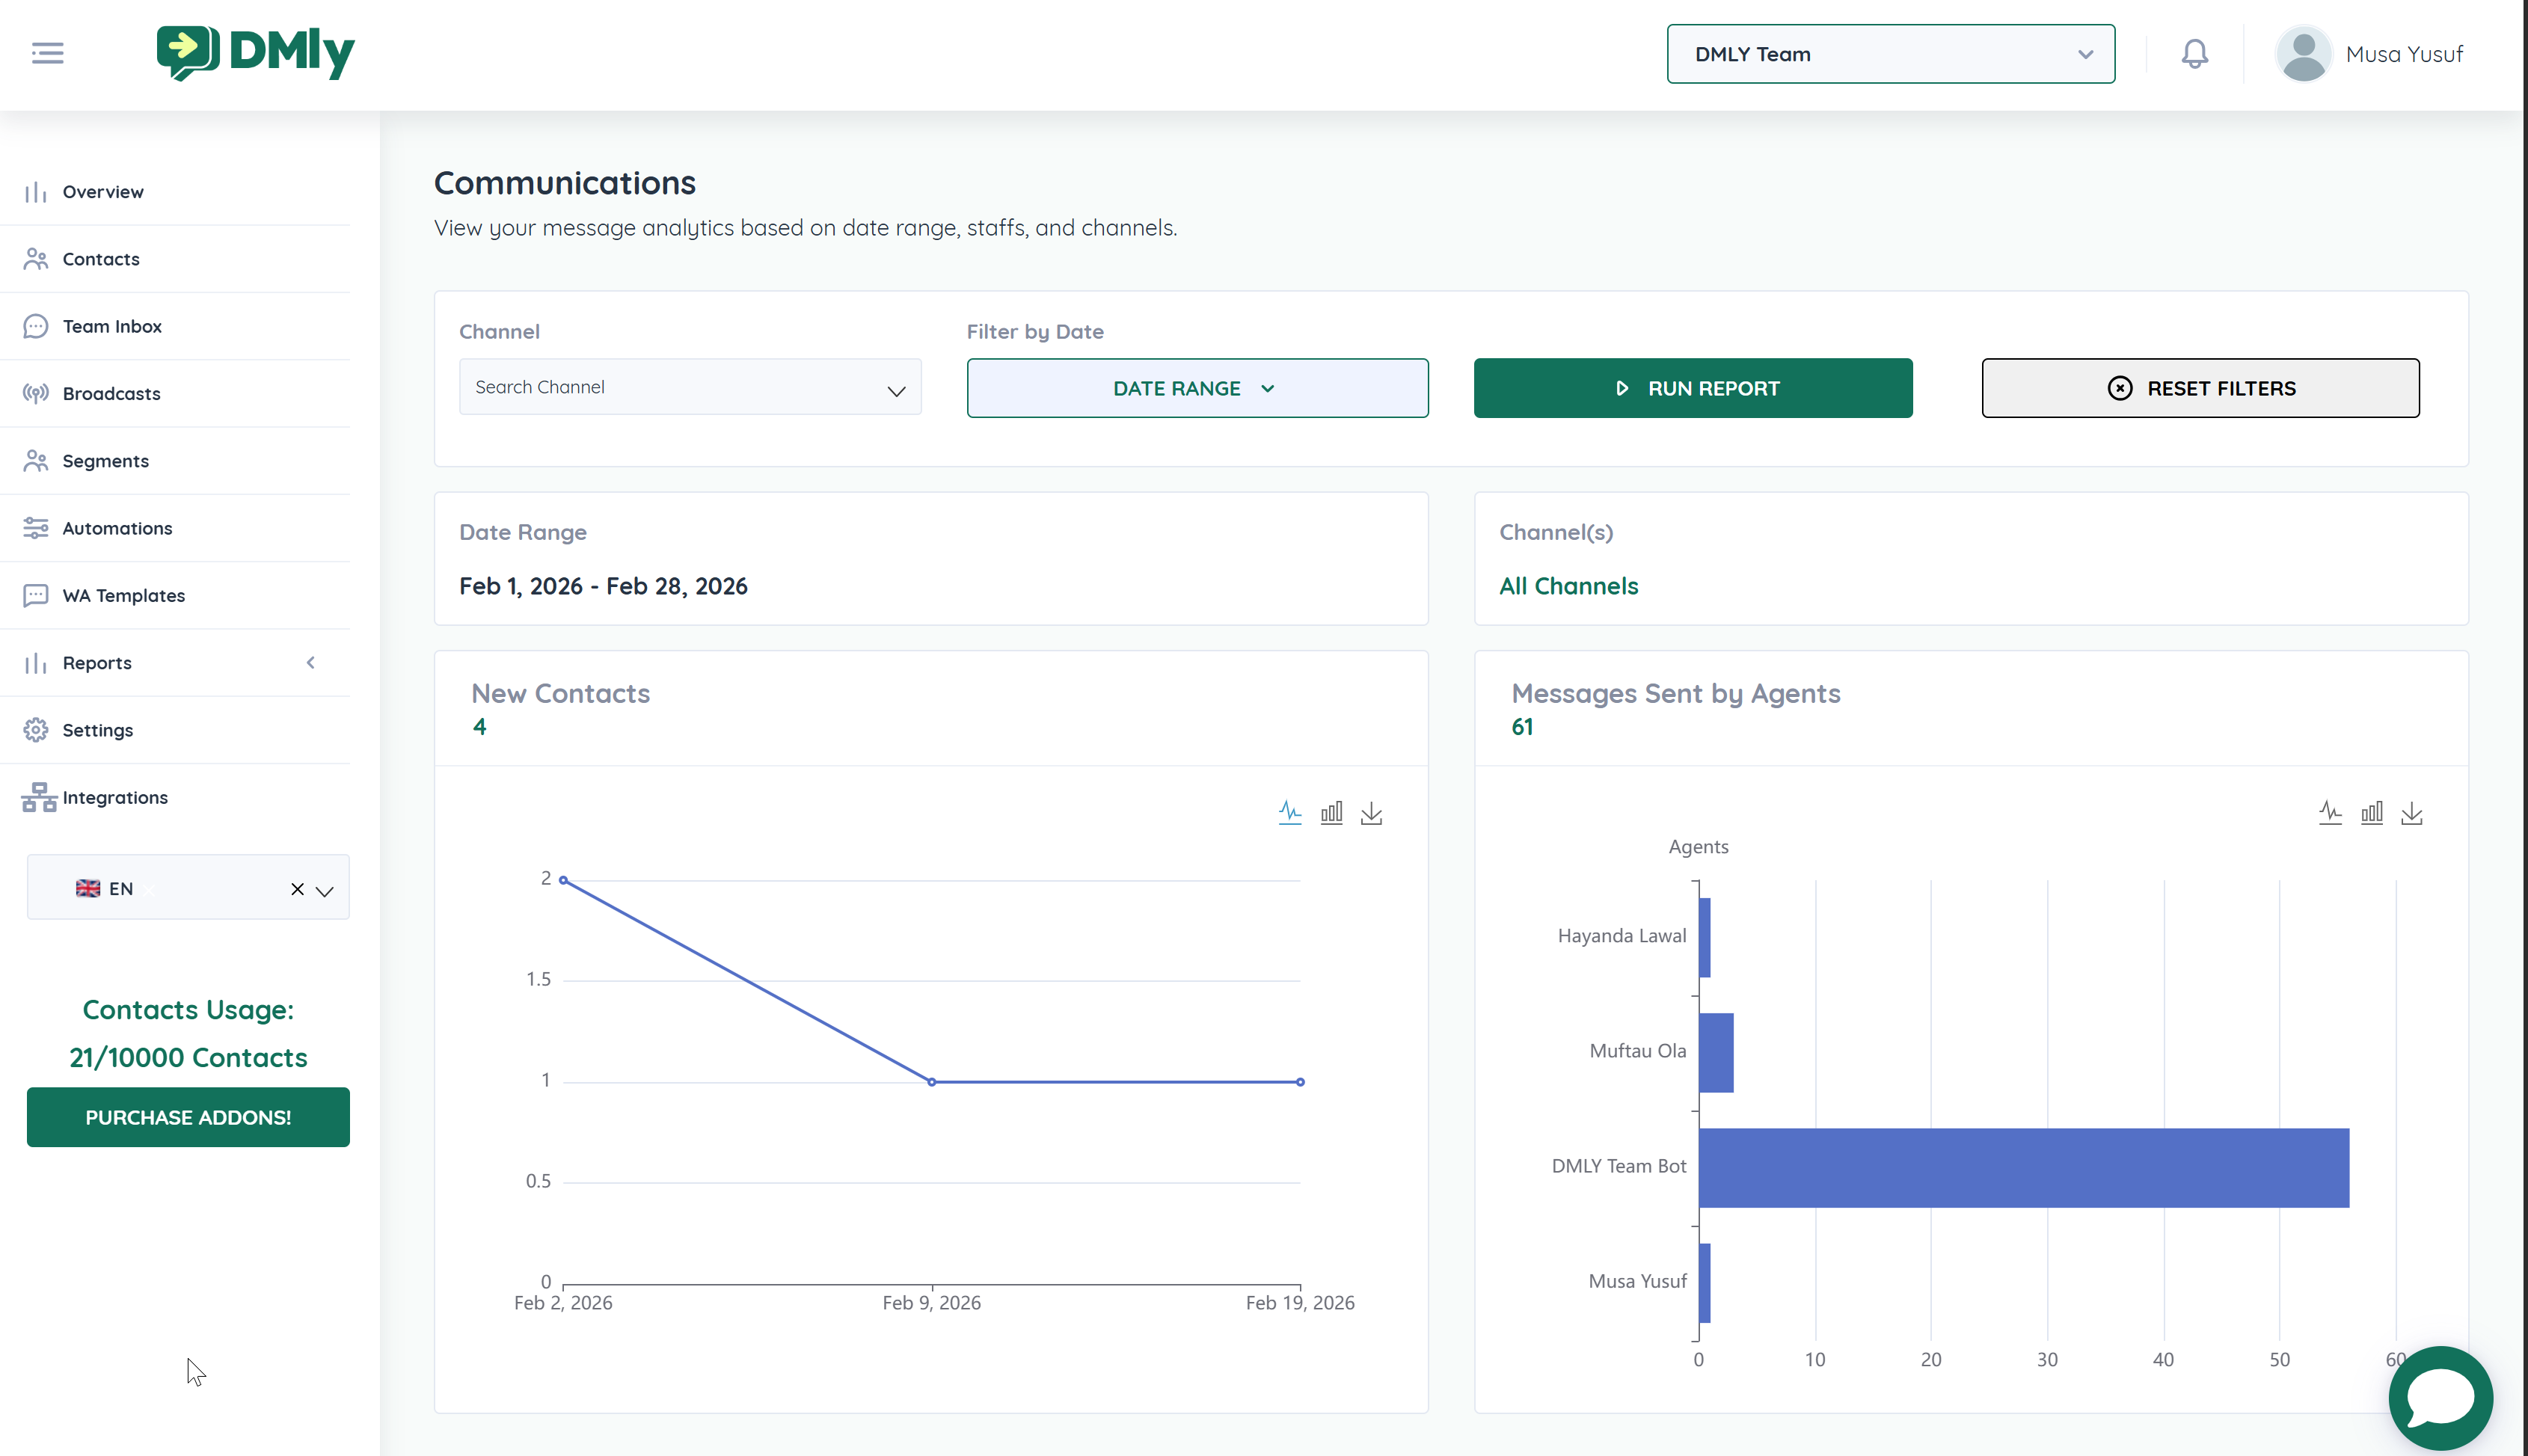
New Contacts
Messages Sent by Agents
Peak Hours Heatmap
), you will see a small download icon in the top-right corner of the card.
This export icon allows you to download the chart directly.
All analytics cards can be exported as:
PNG image files
PNG exports preserve:
Chart visuals
Graph styling
Data labels
Date range context
This makes them ideal for:
Internal reports
Client presentations
Performance summaries
Executive dashboards
Marketing reports
Navigate to Reports → Communications
Apply your desired:
Channel filter
Date range
Click Run Report
On the analytics card you want to export, click the Download icon
The chart will download as a PNG file
You can repeat this for each analytics card to build a complete report set.
Once downloaded, PNG reports can be:
Inserted into PowerPoint presentations
Added to PDF reports
Shared with clients
Included in board updates
Used for performance tracking documentation
Since they are images, they are ready for immediate use — no formatting required.
For professional reporting:
Set a consistent date range before exporting
Export all relevant analytics cards
Combine them into a single report document
Include commentary and insights alongside visuals
This creates a clear, data-driven performance summary.
Exporting reports helps you:
Track growth over time
Demonstrate ROI
Share results with stakeholders
Monitor team productivity
Maintain transparent reporting
With one click, you can turn dashboard insights into shareable business reports.